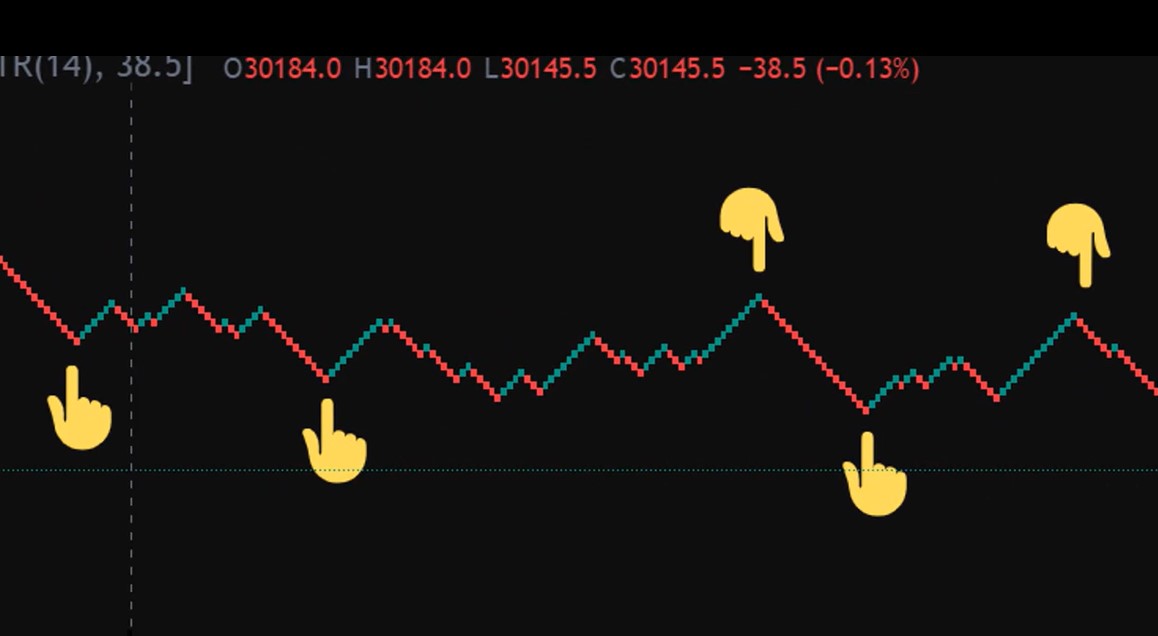
Many people are interested in creating empty grids and numbers for inclusion in the course material. You can create these items with MathType, but it is important to remember that this math software is designed to create mathematical expressions. Grids, graphs, and number axes can be easily created in programs designed for that purpose, such as drawing programs.
Download MathType for PC Download MathType for Mac
By manually manipulating MathType patterns, spacing elements, and positioning controls, you can create these items, but the process takes a lot of time. Let's learn how to create charts, grids, and numerical axes using MathType through the following article:
1. Create charts and grids with MathType
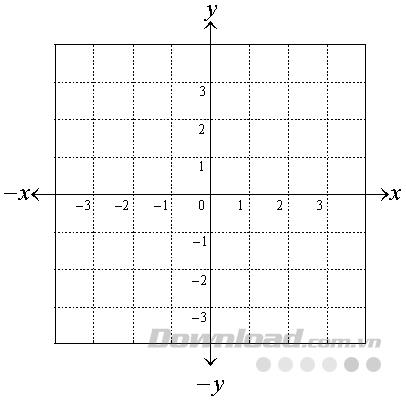
MathType allows you to place divisions in a matrix template, simulating a Cartesian plane. Use matrix patterns without dividing lines so you create things like hieroglyphs and statistical charts, as in the examples below:
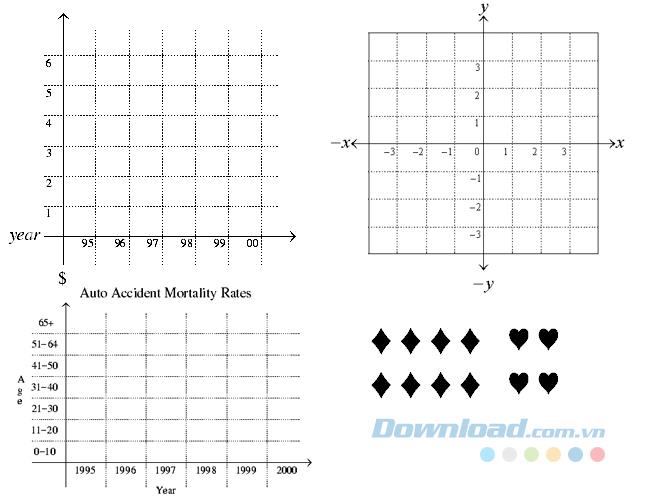
This section guides you through the process of creating a Cartesian plane:
- You open a new MathType equation window.
- From the Format menu of MathType, choose Define Spacing .
- Set Line distance to 100% and Operator distance to 1%. Then click on OK .
Note : Do not forget to reset these values when you finish, otherwise the next equation will not be formatted correctly.
- Type y and press Enter to insert a new line into MathType.
- Select Align Center from the MathType Format menu .
- Insert Upwards Arrow from MathType's Arrows table and press Enter .
- Enter x .
- Insert Leftwards Arrow (arrow pointing to the left) from the Arrows panel .
- Select the Variable-size matrix or table sample from the MathType Matrix sample table .
- Decide on the size of the mesh. You can choose grid size up to 32x32. In this example, Download.com.vn will create a grid of size 8x8.
- In the Matrix dialog box , select Rows and Columns of 8 so the Matrix dialog box appears like:
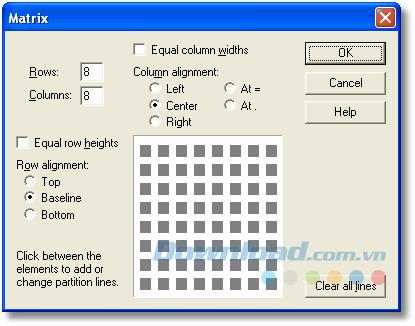
After defining your matrix, start filling out the partition lines. There are four types of dividing lines to choose from: None, Solid, Dashed, and Dotted. Clicking between the gray boxes in the grid will insert the line. The next click will cycle through four types of roads. In this example, we use the seamless lines for the x and y axes and the outer boundary, and the dotted lines to form the squares in the plane. Set your partition paths so that they appear as follows:
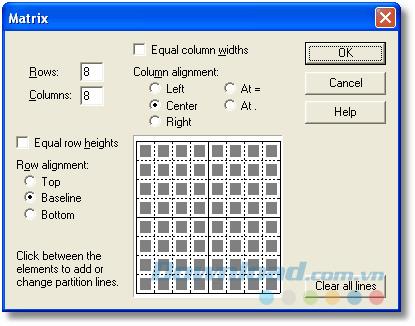
- Click OK to create the matrix in the MathType window. We will fix the link later.
- Move the mouse cursor to the right side of the matrix.
- Insert an arrow to the right (Rightwards arrow).
- Type x and press Enter .
- Insert a left arrow (Downwards arrow) and press Enter .
- Enter y .
- Type the coordinate coordinates into the cells of the matrix. After inserting them, select each cell and click on Subscript from the MathType's Size menu to reduce their size.
In the boxes below the labels 1,2 and 3 in the positive x-axis, change the color to white and enter -2. The purpose of this step is to make the width of each cell's content the same. The numbers -2 will still be displayed in MathType, but not in your document. All elements of your Cartesian plane have been imported, and it will appear as follows:
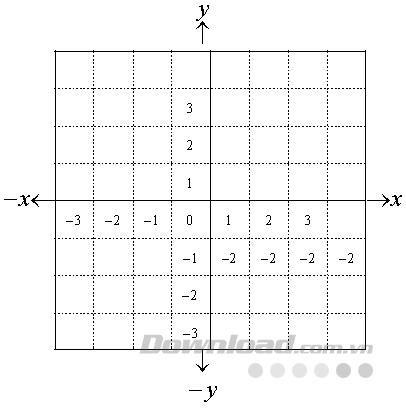
- To align points along the axis, arrow and axis labels, you will need to move the arrows and the label into place.
2. How to create a number axis in MathType
Number axes can be created in MathType through the use of nudging, tabs and double-headed arrow patterns with spaces to enter text below and above.

To create a numerical axis with Mathtype, you do the following:
- Open a new MateType equation window.
- In MathType's View menu , make sure the Show All option is selected so you can see tabs and spaces.
- From the Format menu , choose Define Spaceing and set the Denominator deph to 150%.
Note: Don't forget to reset this value after you're done. Otherwise the equation made in the future will not be formatted correctly.
- Click OK to return to the main MathType edit window.
- Insert double-headed arrows with spaces to enter text above and below
 .
.
- In the space above, enter the vertical line character, | , which is Shift + \ on your keyboard.
- Insert a tab after vertical line characters by pressing Ctrl + Tab . You should see the following image in the MathType window:

- Repeat the 2 steps above 5 times to replace 5 more tabs and 5 vertical lines, then add one last vertical line so that you have the image as below:

- For the space below, enter the range of numbers starting with -3 followed by a number with a tab, so that your number line appears as:

- Select all the tabs in the empty position above of the two-headed hats and drag them down until the vertical line characters are split, marking the coordinates on your number axis as follows:

- Move the negative coordinates to align them with the vertical bars, and you should have the complete number line below:

- Tick only appears when you turn on the Show All option . If you turn off the Show All option or insert a number axis into the document, it will appear as below:

You can also increase or decrease the space between coordinates by inserting your own tab points instead of using MathType's default.
See more:


